
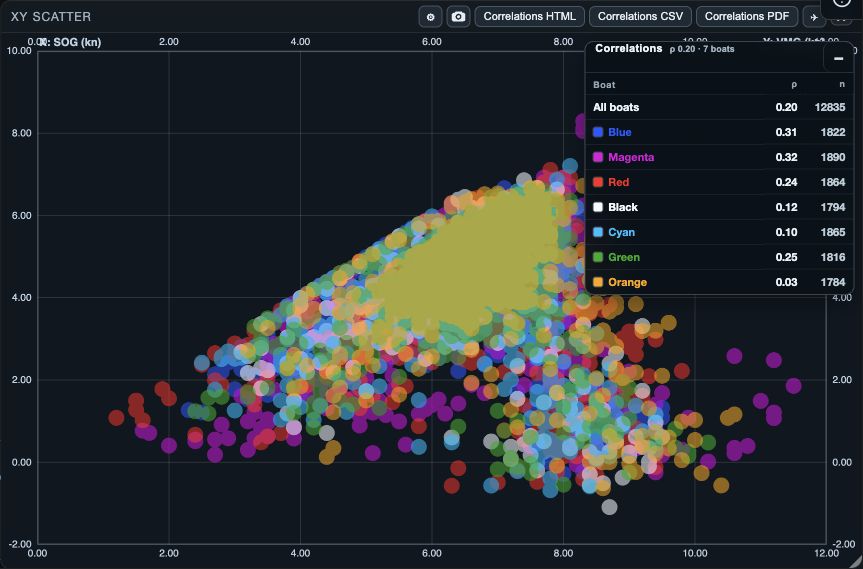
What the XY plot uses
XY plots one selected value against another for the open boats. Each dot is a sample; heat maps show where samples gather. Trend lines and correlation figures help compare the relationship between the two values, such as speed and heel.
1. Choose a useful pair of values
1. Open XY from Windows on web/desktop, or the workspace panels menu or Choose windows on native. 2. Open Settings or Options. 3. Choose X Value. 4. Choose Y Value. 5. Return to the plot and check the axis labels before interpreting it. 6. Use Track, Graph, or Table to verify a surprising cluster or outlier.
Choose values that are present for the boats and period you selected. A plot with few points can be honest evidence of limited data; it is not a reason to infer a strong relationship.
2. Set the display for the question
1. Select Dots when you need to see individual spread and outliers. 2. Select Heat Map for fleet concentration. 3. Select Boat Heat Map to distinguish each boat’s concentration. 4. Adjust Dot size and Dot / heat-map alpha until overlap is readable. 5. Use Trend thickness and the overlay controls only after the data points are visible.
- Boat trend lines show each boat’s fitted trend.
- Overall trend line summarizes the selected fleet.
- Boat correlations show a correlation and sample count per boat.
- Overall correlation summarizes the selected fleet.
3. Keep the result understandable
Use Restore Defaults if an experimental display obscures the data. Use Export XY screenshot to share a chart; its image includes axes, trend lines, correlations, and a settings summary when those are active. It does not save a new telemetry dataset.
If the plot is unhelpful
- Empty plot: confirm open boats, the selected range, and that both chosen metrics exist in that data.
- Dense, unreadable plot: reduce dot size or alpha, or switch to a heat map.
- A strong-looking trend: inspect the individual boat lines and correlation sample counts.
- Unexpected fleet pattern: select one leg or a narrower range, then compare it with Track and Graph.
- Settings became confusing: choose Restore Defaults and set one display choice at a time.