
Choose the values before comparing them
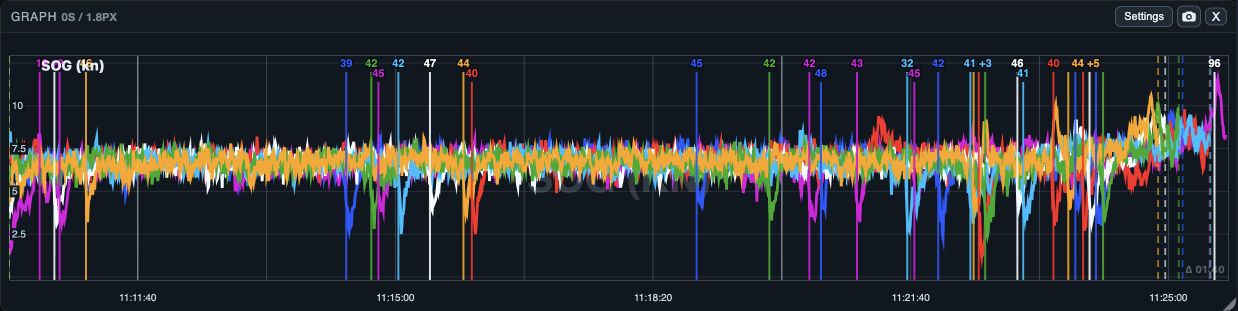
Graph plots recorded and calculated values against time for the open boats. Each selected value has its own pane; leg and manoeuvre markers show where changes happened. Choose Values to change the panes. The default is SOG.
The picker is staged: cancel leaves the committed metric set unchanged, and Apply commits a changed selection. The graph uses open boats and the selected intervals; Library row selection is not a graph filter.
Inspect a moment or select a range
On the native apps, use the inspection mode to place a crosshair and read the time and each boat’s value. The inspection summary includes minimum, average and maximum for the shown values. Native range mode lets you drag across the plot to send that start and end back to the shared time selection.
- Native inspection answers “what was each boat doing here?” without changing the selected range.
- Native range selection answers “which interval should every analysis view use next?” The resulting range changes Track, Table and other views that use the shared selection.
- If no data appears, widen the selected interval or check that the metric exists for the open logs.
Make the lines readable
Smoothing averages the displayed series over a chosen number of seconds. It helps reveal a trend, but it can hide a short gust, tack or data spike. Keep it at 0 seconds while locating a specific event; add only enough smoothing to compare the trend.
Graph Settings also changes Line thickness, Hover info (Time + data or Time only), Show leg lines, Show maneuver lines, Show maneuver numbers, and the Updist or Loss label used for manoeuvre numbers. These presentation settings apply live.
Export and recover
Export Graph screenshot creates a PNG of all selected panes with its summary context. It does not change the logs or selected time range. Refresh asks the host to prepare the graph again if a view is stale or reports an error.
A blank graph can mean there are no values in the selected intervals. Check the time selection and value choice before treating it as an import problem.