
Choose events and values
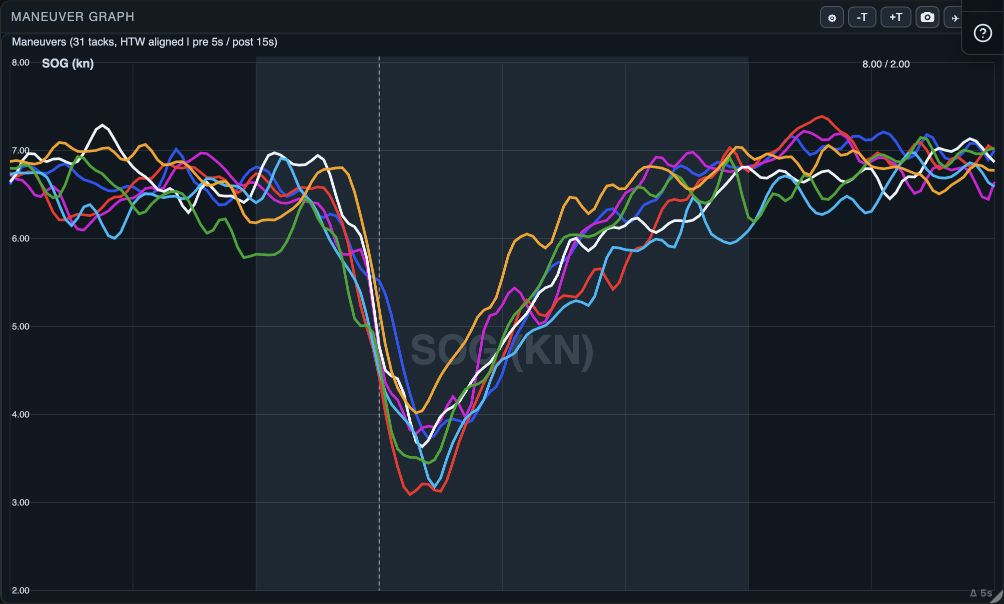
Maneuver Graph overlays values from detected turns on one time scale, aligned at the detected transition. Choose SOG or VMG to compare speed loss and recovery, or heel and pitch to compare handling. Use checked rows in Maneuvers List to emphasize or isolate turns.
The graph aligns manoeuvres around their detected transition. It is for comparing the shape through a manoeuvre, not for replacing the full-time Graph view.
Read individual and typical lines
Show thin draws individual event lines; Show typical adds a representative line. Smooth them separately to reveal a repeated trend while retaining enough individual detail to spot a poor tack or gybe.
Boats limits the fleet, and Checked Rows lets you emphasize selected events or show only them. Use the List to change which events are checked; Graph Options does not re-detect or edit an event.
Handle travel carefully
Clip travel thin lines to transition limits thin travel lines to the transition span. Use it when extra approach or recovery context overwhelms the turn. Leave it off when that wider context is exactly what you need to compare.
Export the graph
Export Maneuver Graph screenshot creates an image of the selected graph presentation. Native uses the system share sheet. State the event type, values, selection and smoothing alongside an exported graph so another coach can interpret it.