
Set the question first
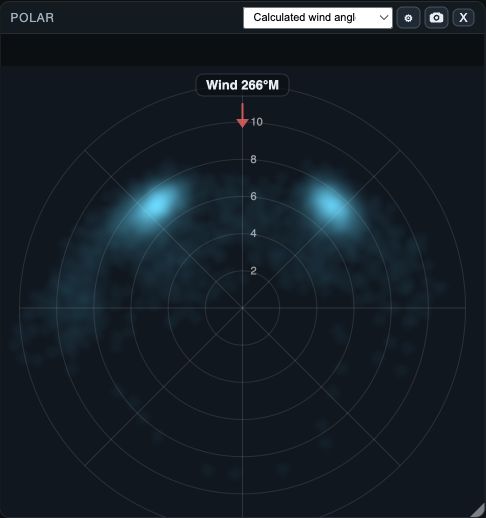
Polar plots speed against angle to the wind for the open boats in the selected interval. Angle runs around the plot; distance from the centre is speed. Wind is at the top, so the left and right sides show the two tacks. Choose the angle source in the header before comparing boats.
Use a clean, comparable range first. Mixing manoeuvres, low-speed recovery, prestart and different wind bands makes a dense plot, but not necessarily a useful polar.
Choose a readable display
Polar Settings offers Dots, Heat map and Boat heat map. Dots preserve individual samples; Heat map shows fleet density; Boat heat map separates density by boat. Dot size is available for Dots, while Dot / heat map transparency applies to the selected display.
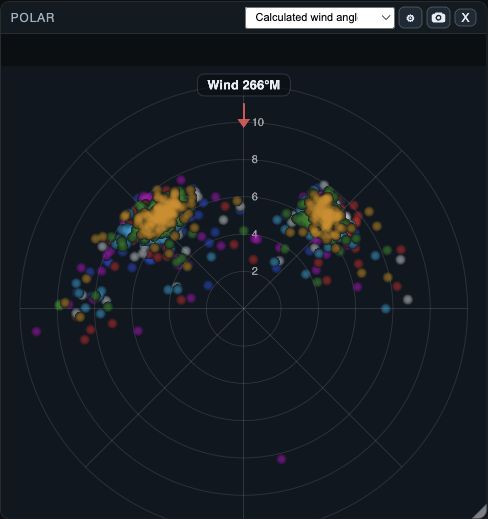
- Each colored dot is an individual sample; color identifies the boat.
- The two lobes separate the port and starboard sailing angles.
- Distance from the center is speed, read against the radial rings.
Low-speed cutoff removes samples below a percentage of the maximum speed. Use it to reduce drifting or recovery noise, but state the cutoff when comparing a screenshot with another session.
Filter on the Polar plot
Long-press a location on the plot. The app reads speed and absolute angle to wind at that location and opens the filter menu. On web and desktop, right-click also opens it.
- Circle: choose a radius in knots around the picked speed and angle. The outline is a preview. Choose OK on web/desktop or Apply circle on native to use it; Cancel leaves the filter unchanged.
- SOG above/below: keep samples faster or slower than the picked speed. ATW above/below: keep samples at greater or smaller absolute wind angles. These four choices apply as soon as you select them.
- To clear the active Polar filters, long-press again and choose Remove polar filters. This choice appears only when a Polar filter is active.
The Polar window shows the active-filter count. Filters also affect other analysis views that use the shared selection, so check Track, Graph or Table after applying one.