
Start with a usable start reference
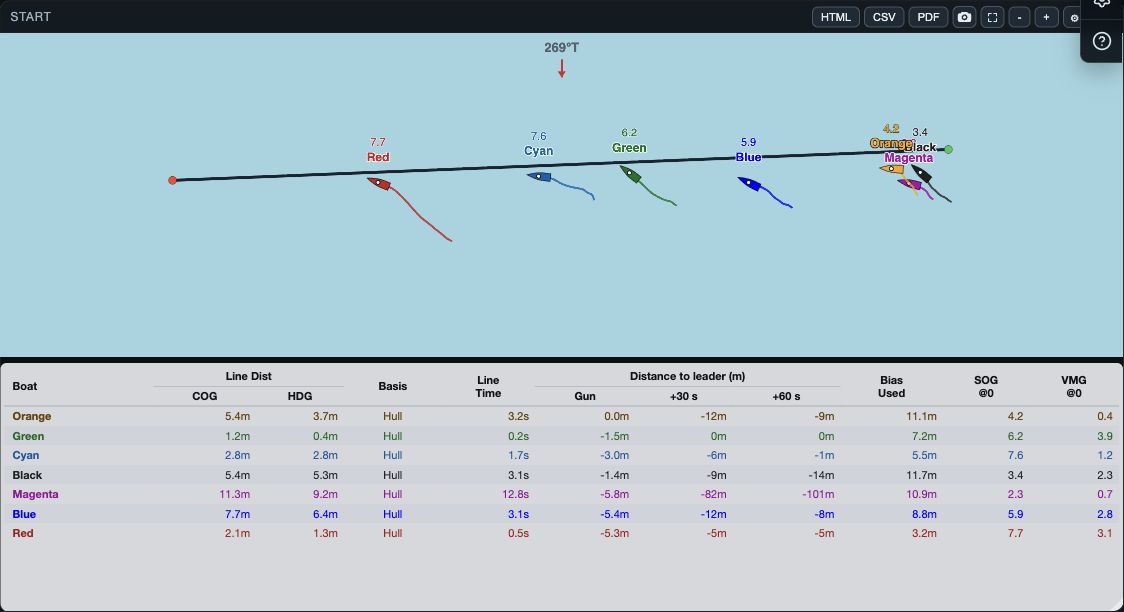
Start shows each boat’s approach to the line and a table of line distance, crossing time and early separation. Open the fleet, select the time around the gun, and check the line and wind before reading the figures.
The window can show conventional and reach-start geometry, line crossings and distance bases from the available race data. It cannot establish a missing or incorrect line merely by drawing a convincing picture.
Read the plot and table together
The plot shows each boat within the configured approach window around the gun and the start geometry. The table puts the corresponding comparison values below it. Use them together: a boat can look close to the line while its course, heading, crossing time or distance to the leader tells a different story.
- Line Dist COG and HDG report line-distance readings using course over ground or heading; Basis tells you which basis applies.
- Line Time is the line-crossing timing. Gun, +30 s and +60 s compare distance to the leader after the start.
- Bias Used, SOG @0 and VMG @0 provide the context for an aggressive or conservative approach. VMC @0 is shown for reach starts.
Select a table heading to sort by that column; selecting it again reverses the sort. Sorting changes only the order of the table.
Frame the start
Use Auto Zoom or Auto fit to return to the prepared start framing. On web and desktop, − and + adjust zoom. On native, pinch to zoom and drag to pan. These actions affect the saved view state, not the race samples or line geometry.
When a boat appears outside the plot, use Auto fit before concluding that it was outside the line. A manual pan or zoom may simply have moved the comparison out of frame.
Show the data you need
Start Settings has Show team names, Show value numbers and Show distance lines. Those display toggles apply immediately. Turn off labels when paths overlap; leave distance lines on when evaluating separation from the line or reference.
Value metric chooses the measurement printed beside boats. Its picker requires a confirmed changed selection. Cancelling keeps the previous metric.