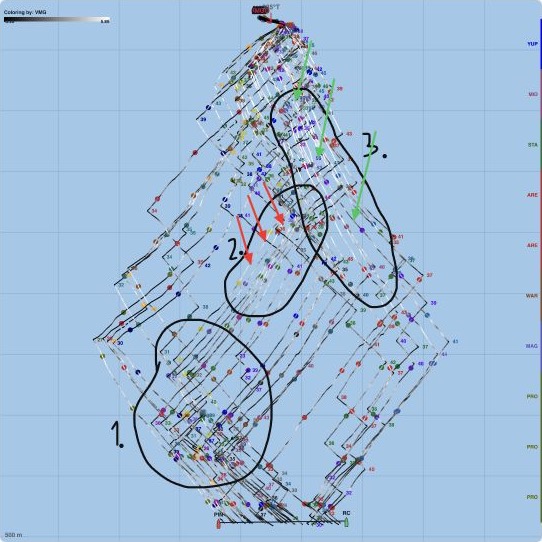
01 · Tactics
See where the race changed.
Annotated tracks connect decisions with the shifts and opportunities around the course.

Sailing race reports · SailViewer Reports by Ivan Bulaja
Race and training data, a coach’s perspective and a clear explanation of the moments that shaped performance around the course.
Discuss your eventInside the analysis
These report excerpts show how tracks, start-line data and performance comparisons can bring a race into focus.
01 · Tactics
Annotated tracks connect decisions with the shifts and opportunities around the course.
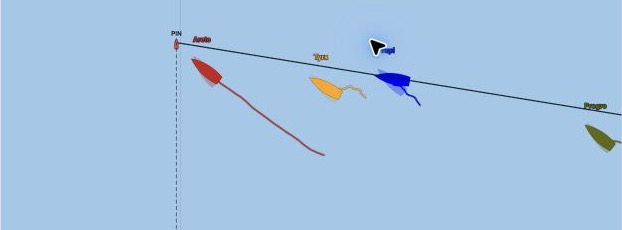
02 · Starts
Line bias, distance and early progress put the starting position in context.
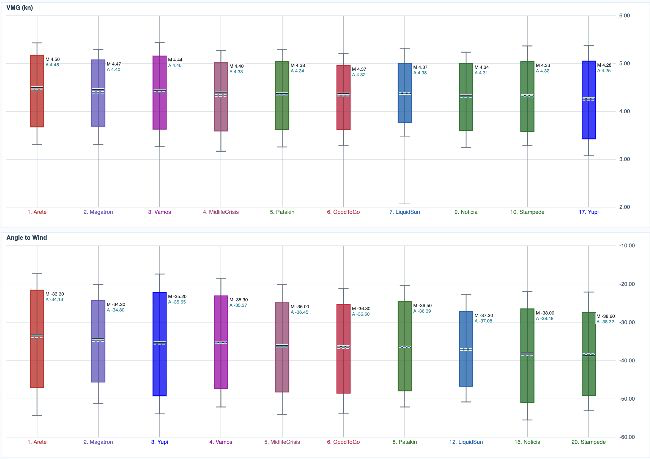
03 · Performance
See the spread behind the averages alongside the tracks and tables.
A complete debrief
Race area, course geometry and wind context.
Line setup, boat positions and opening progress.
Gains, losses and the decisions behind them.
Approaches, choices and time through the turn.
Tracks, graphs, tables and polars in context.
Key moments prepared for a clear team debrief.
The person behind the analysis
Sailor. Coach. SailViewer developer.
Ivan built SailViewer to answer the questions he had as a coach. Reports apply that same approach: understand what happened, explain why it mattered and find something useful for the next race.
Ivan has been to seven Olympic Games and brings years of coaching experience in SailGP and other high-performance sailing programmes.
Working together
Agree the teams, schedule and questions.
Send the agreed original files after racing.
Use the analysis with your team.
Plan your event