
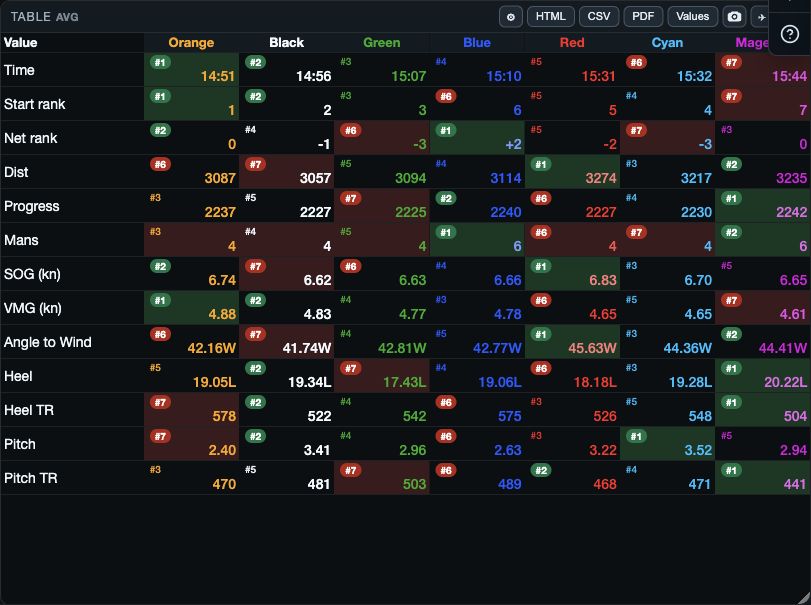
Read the comparison matrix
Table shows a summary of each selected value for every open boat in the selected interval. Values are rows, boats are columns, and each value keeps its own unit. Choose Average, Median, Mode or Std Dev to change the summary.
The default selection includes time, rank, distance, progress, manoeuvres, SOG, VMG, wind angle, heel and pitch measures. Choose Values to tailor the matrix to the coaching question.
Choose the aggregation deliberately
Use Average for the usual interval comparison, Median when brief spikes should carry less weight, Mode for the most common bucketed value, or Std Dev to understand variation. Mode offers Auto bucket sizing or Manual and a positive bucket size.
Changing the aggregate applies live. It changes the displayed summary, not the underlying log samples or the shared time selection.
Sort and emphasise the fleet
Select a metric row to sort boats by that value; selecting it again reverses the direction. Use Color best/worst to highlight comparable ends of the row and Show fleet rank to show rank pills. These are aids for scanning, not a substitute for checking the metric definition and selected range.
The boat header can also offer fleet-role choices. Focus and Watch change emphasis for the analysis session; they do not rename, close, archive or save the boat.
Set up a readable table
- Show Port/Stbd split adds separate port and starboard values when the selected metric and data support the split.
- Font size, Number thickness and Text colors change presentation. Choose Boat colors to retain a boat’s identity or White / black for a neutral report-style view.
- On web and desktop, Auto-fit table to window controls layout inside the scrollable table. It is a web/desktop option; native source does not expose that control.
Table settings apply live. The Values picker is the exception: it needs a confirmed changed selection, and Cancel preserves the committed values.
Export the table
Export Table screenshot creates a PNG of the full matrix, including all rows and boats and a settings summary. Native uses the system share sheet. Native Table currently offers PNG screenshot export.
Web and desktop visibly expose HTML and CSV buttons in addition to the screenshot action. HTML, CSV and PDF Table exports are not currently available on iPad, iPhone or Android.