
 SailViewer
What really happened
on the water?
Import your sailing logs, compare boat tracks and performance, and bring clearer evidence to the race or training debrief.
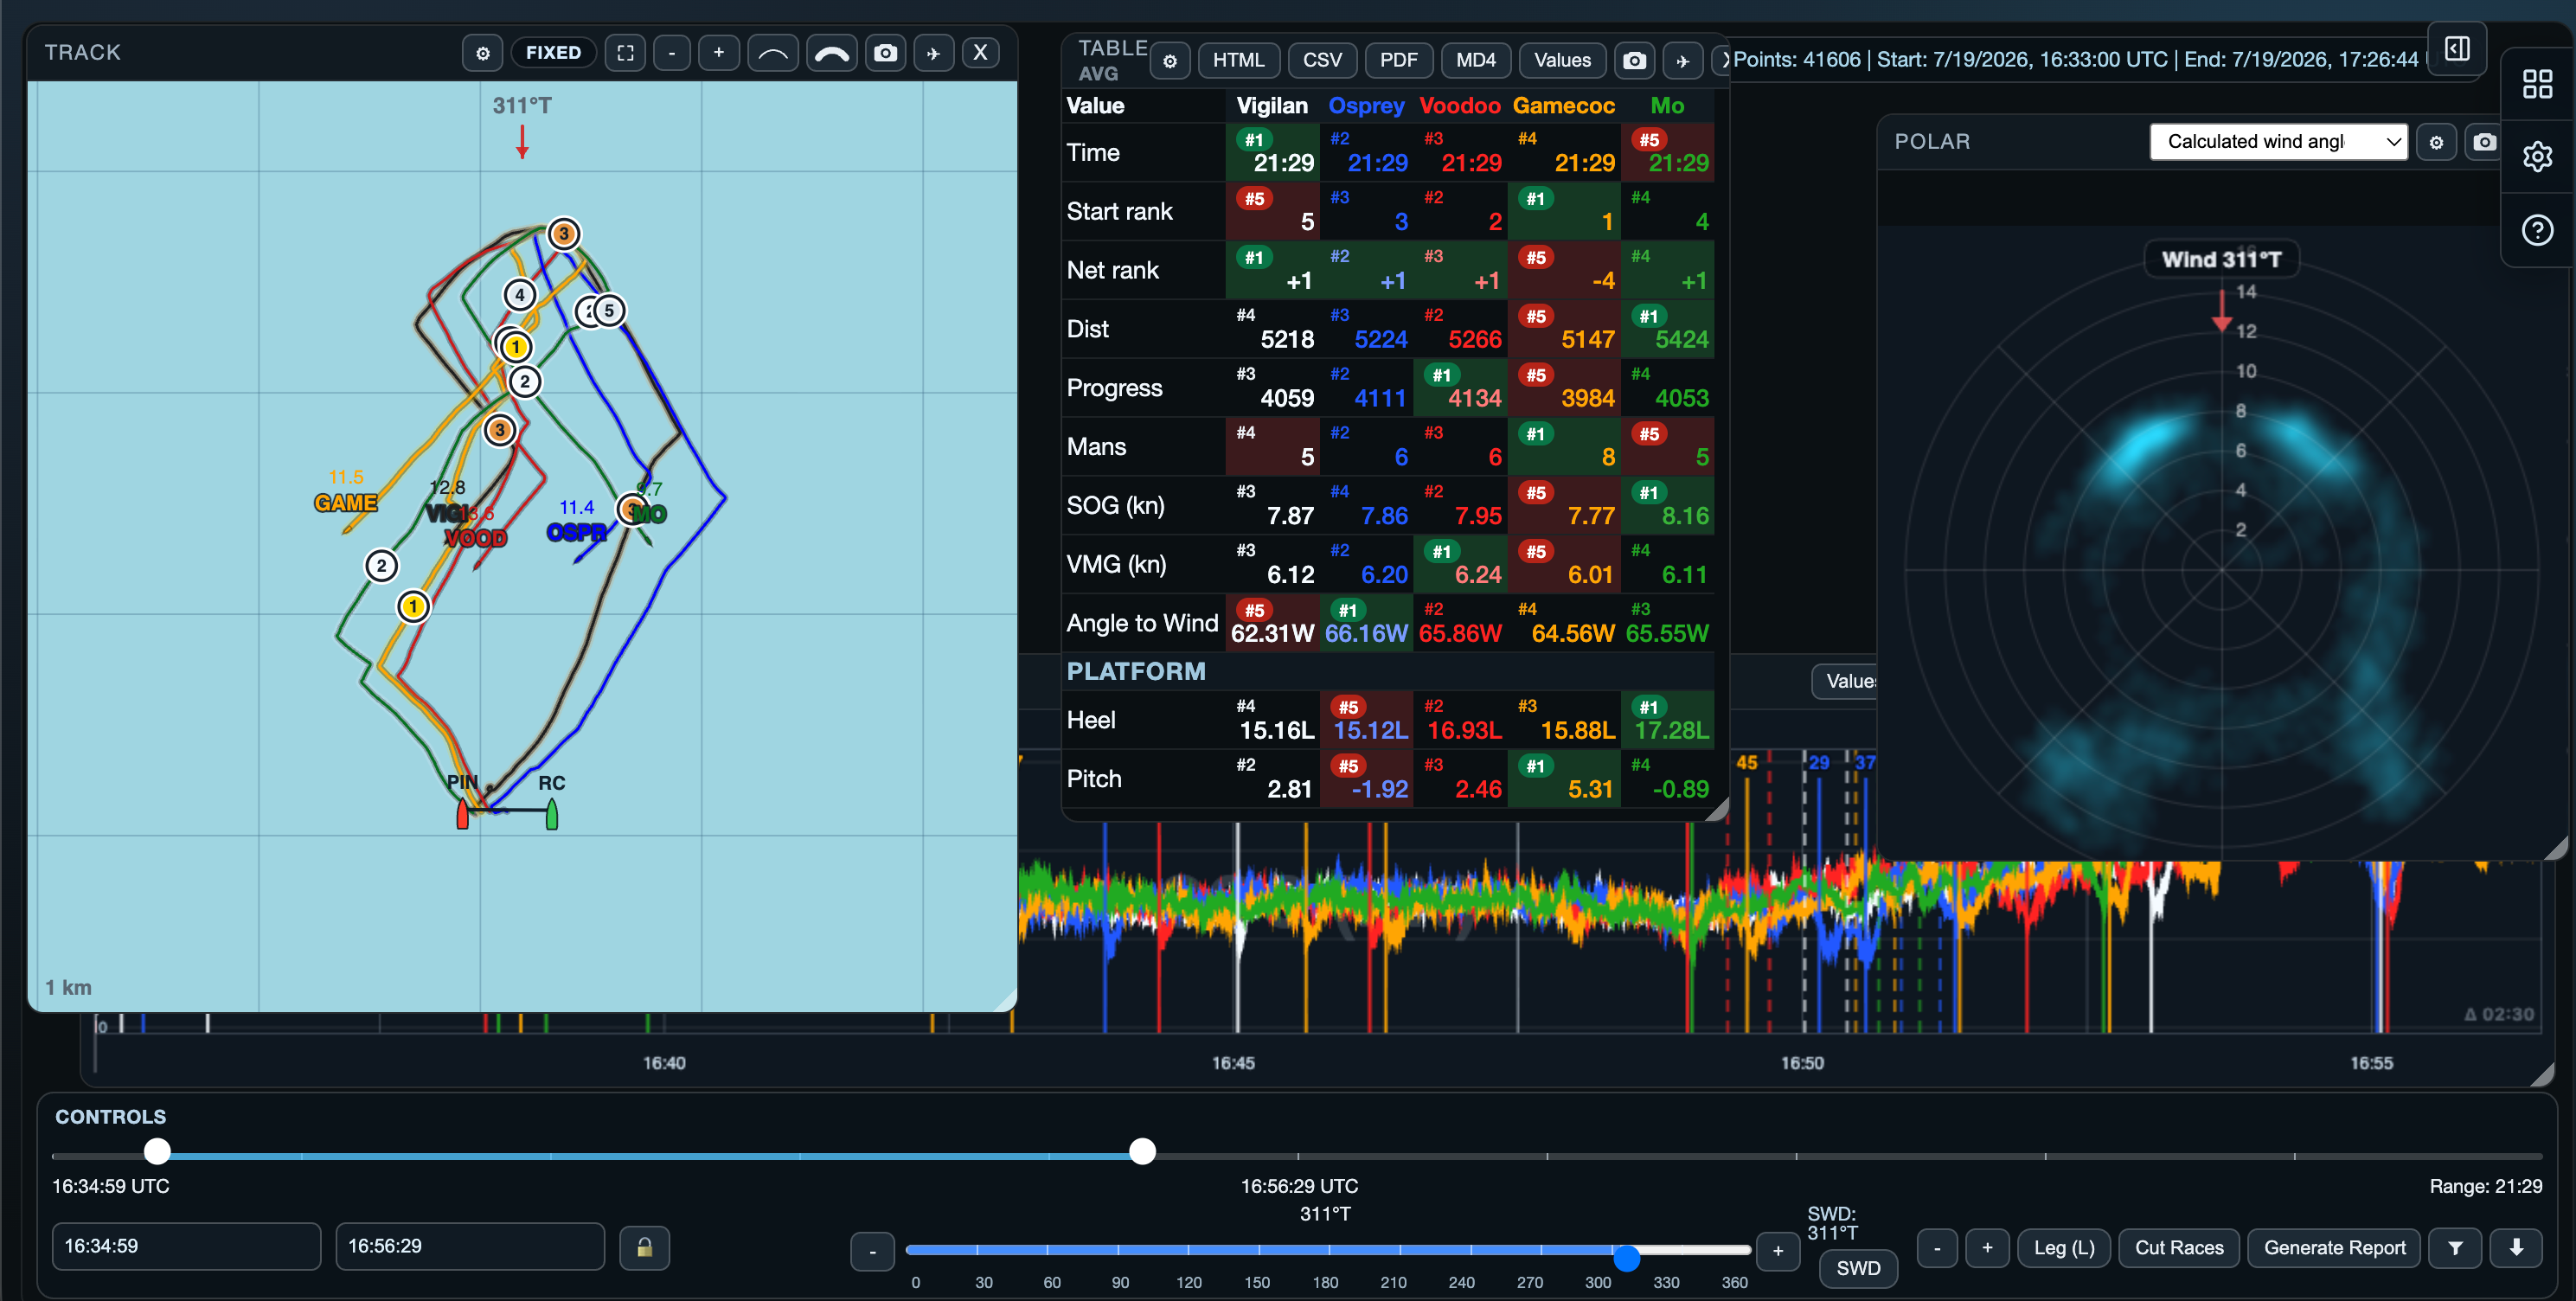
The analysis workspace
Different views.
One selected moment.
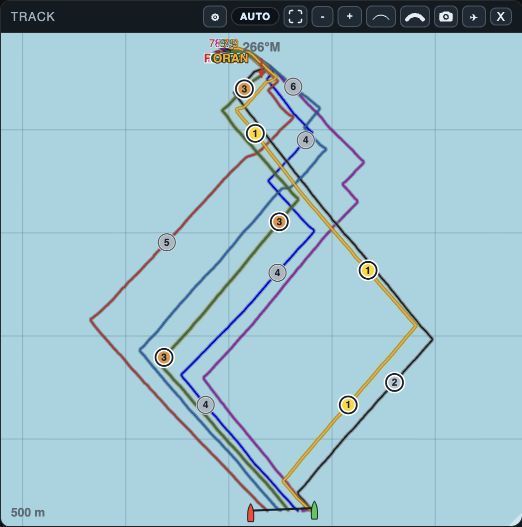
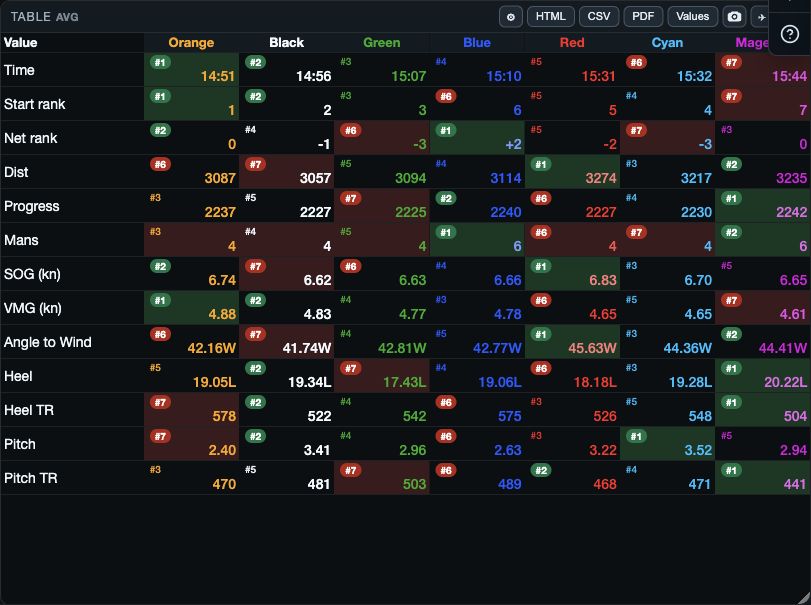
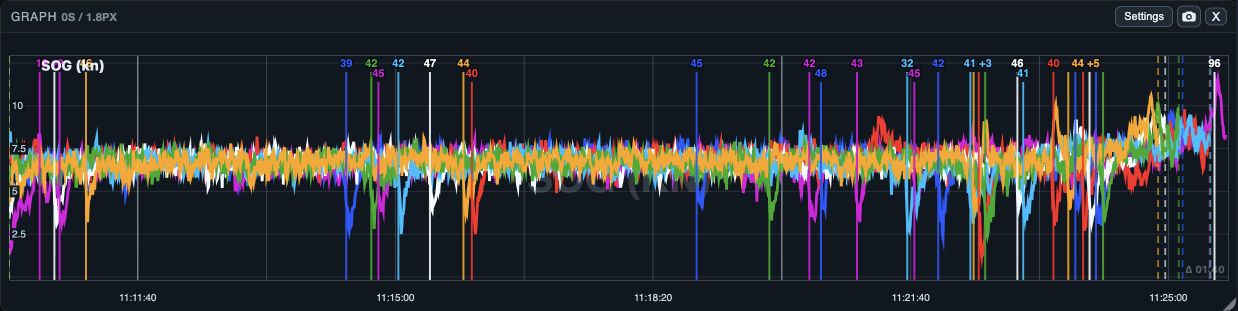
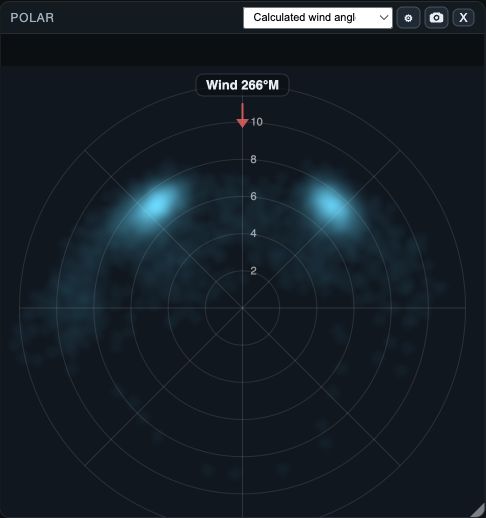
Maneuvers
Compare every turn.
Review tacks, gybes and roundings through tracks, graphs, lists and summaries. See how boats turn, lose speed and recover.
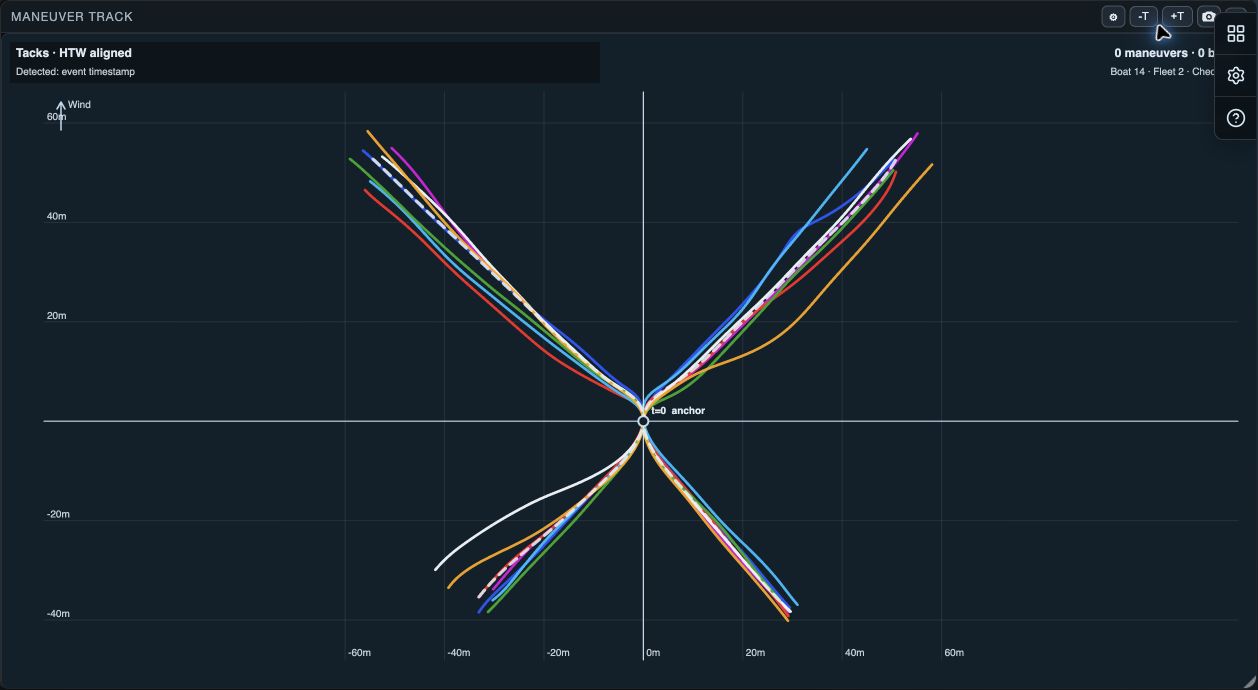
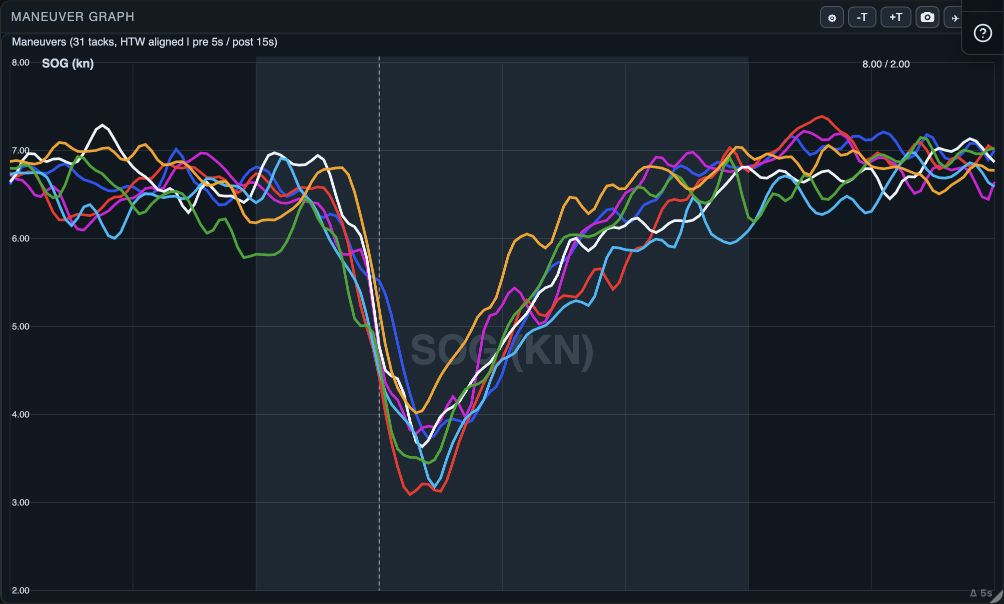
Beyond Track, Table, Graph and Polar
More ways to view your data.
Explore starts, races and boat performance, with more views for distributions, relationships and detailed values.
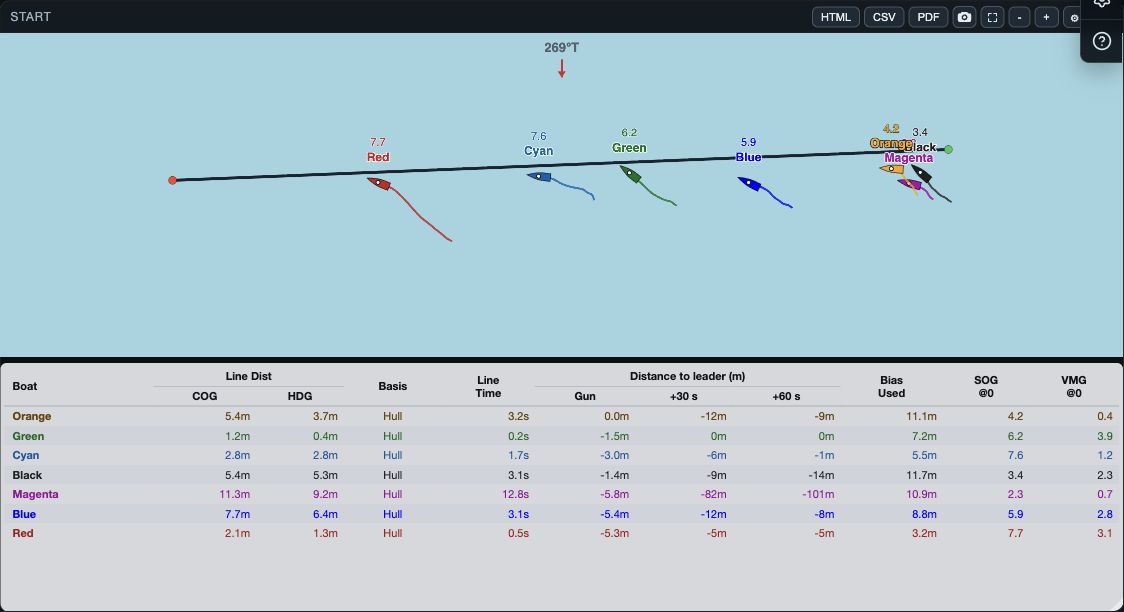
Start
Compare position, timing and speed at the line.
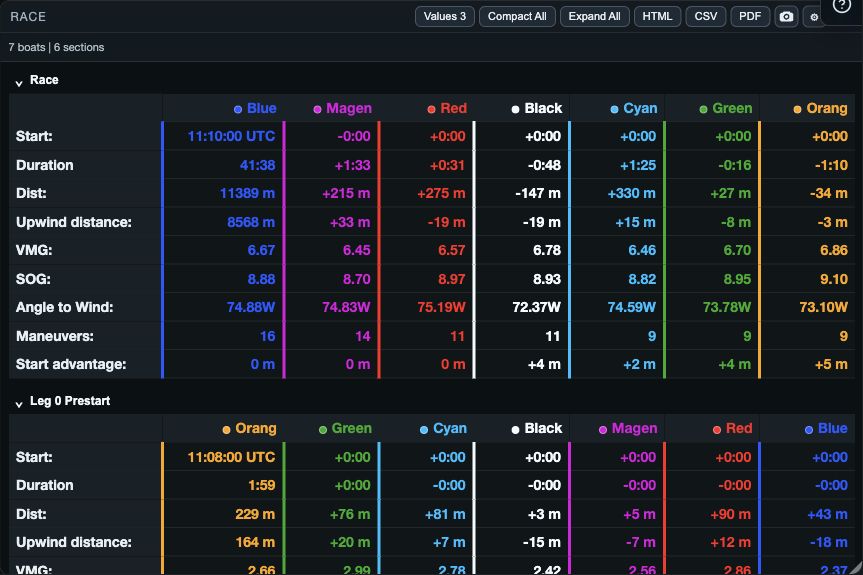
Race
Compare the race and each leg, boat by boat.
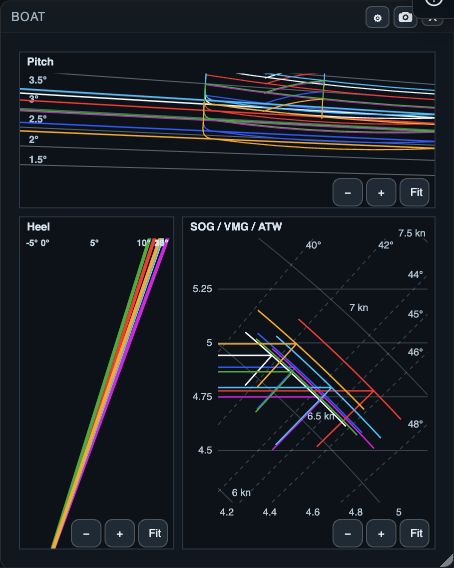
Boat
Connect trim and boat data with performance.
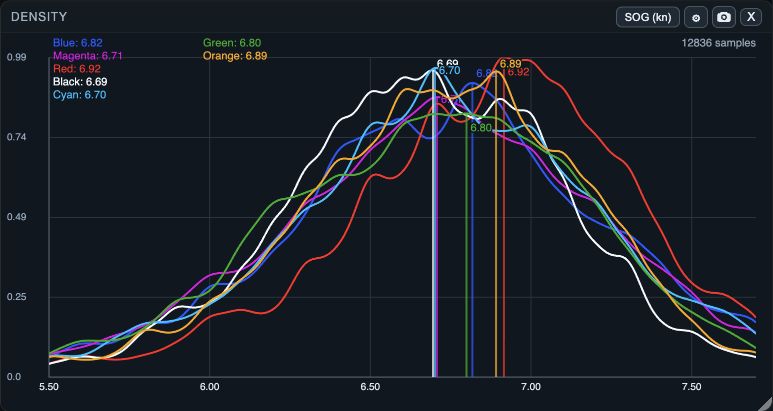
Density
See how often boats reach different speeds and values.
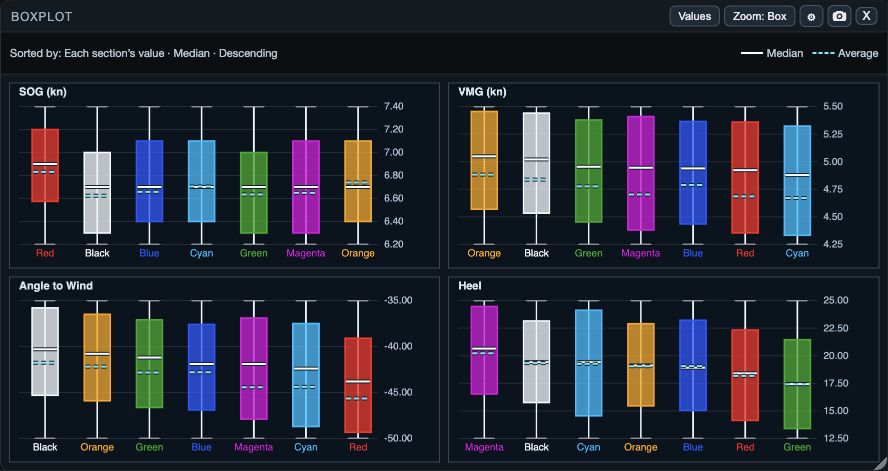
Boxplot
Compare typical performance, spread and consistency.
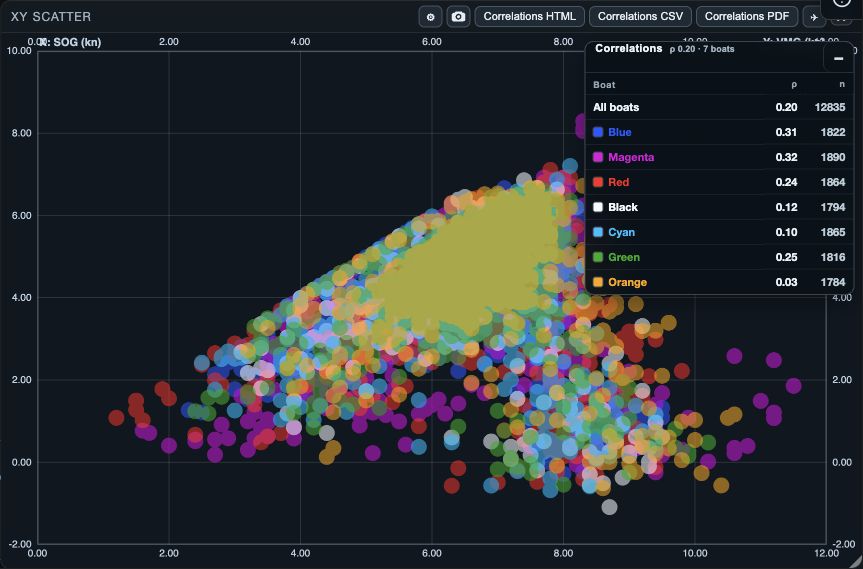
XY
Explore relationships between two sailing values.
Also explore Values and Segments.
The phone workspace
Focused analysis.
In your hand.
Follow the race tracks and compare boats in a view shaped for your phone.
Ordinary non-folding phones stay free. Tablets, foldable phones and computers are free through 31 December 2026.
Find your version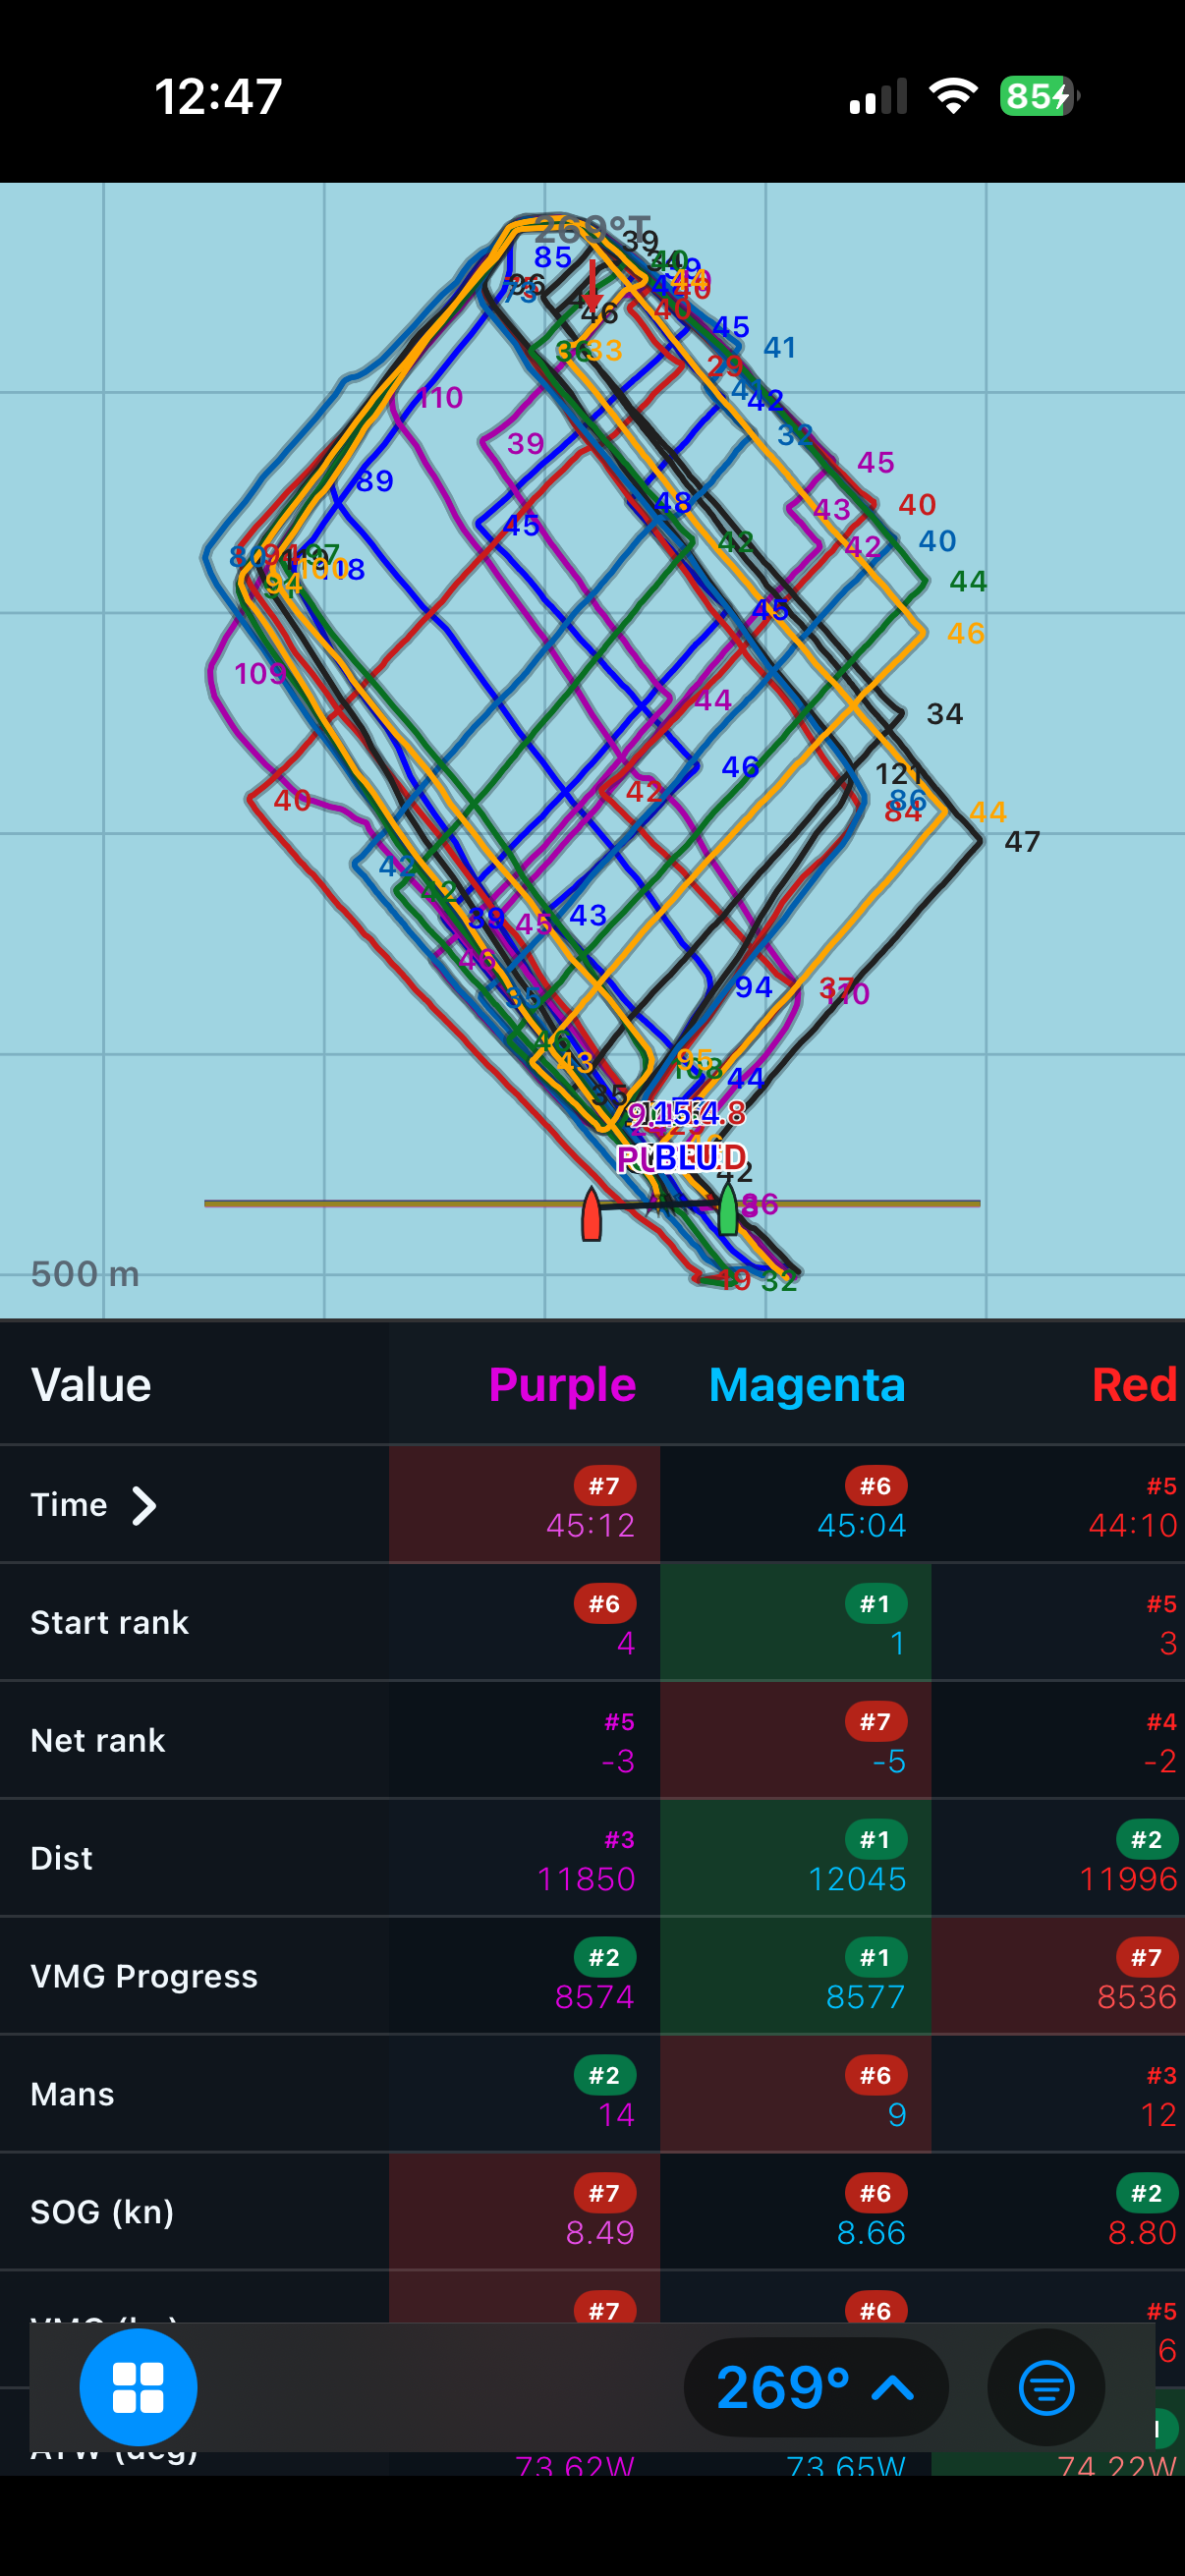
Start with your session.
Open your sailing logs and turn the selected moments into useful answers.
Get SailViewer